It’s always bittersweet when the holidays are over.
I love Christmas time. The decorations. The parties. The food. The movies. Family time.
But I also have something to look forward to when the kids finally go back to school after Christmas break — it’s to update some historical stock market data!
I rely heavily on two sources when it comes to historical performance numbers: Returns 2.0 from DFA and the annual return numbers from NYU.
Here’s a scatterplot of calendar year returns I update annually going back to 1926:
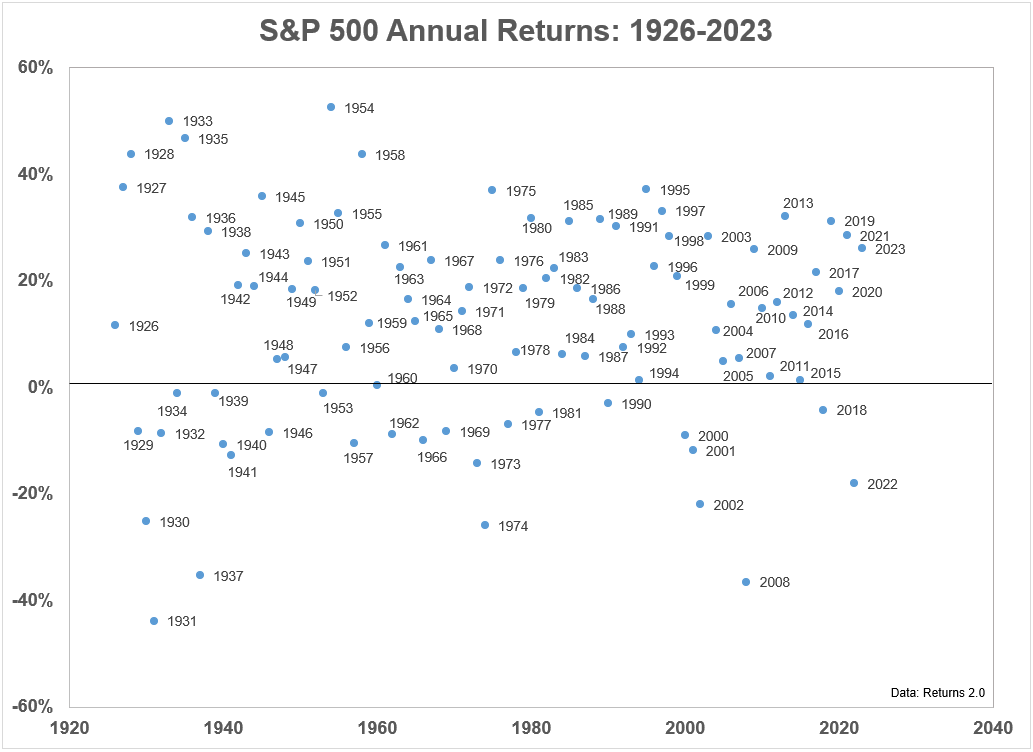
I love this chart because it illustrates just how random the stock market can be in any given year. Big gains. Big losses. It’s all over the place. A random walk down Wall Street, if you will.
If you want consistency, the stock market is not the place for you.
Or is it?
Returns are certainly inconsistent over the short run.
However, longer run returns are relatively consistent if you extend your time horizon.
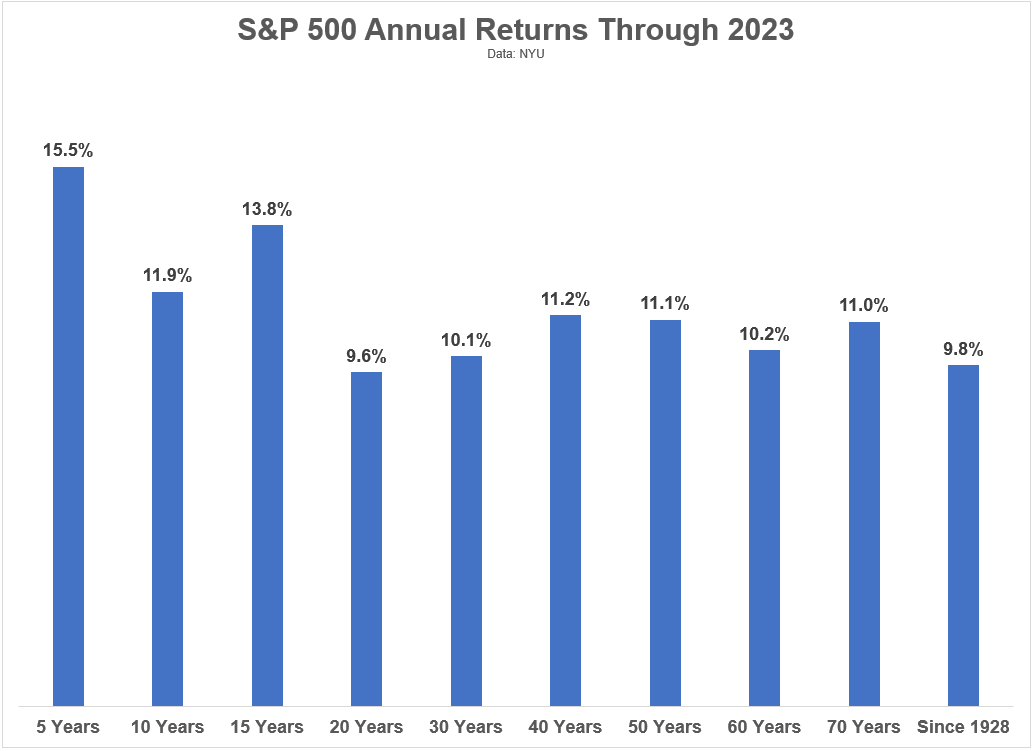
These are the annualized returns for the S&P 500 through the end of 2023 over various periods:

Not bad, right?
Even with the 2022 bear market and the Covid Crash in early-2020, the 5 year results have been lights out.
But look at how consistent annual returns have been over multi-decade time frames. I can’t promise you these returns will look the same going forward but this is the reason you need to think and act for the long-term when investing in the stock market.
So many terrible events have taken place over the years — war, recessions, financial panics, etc. — yet the historical return numbers bake all that into the cake and it turns out lovely.
Of course, there have been below-average returns in the stock market, even over decade-long periods. You wouldn’t get such wonderful long-run returns without some risk.
The year 2000 is likely the worst entry point in U.S. stock market history, at least from a valuation perspective. Since the start of that year the S&P 500 is up just shy of 7% per year. That’s not horrible but it is below average.
In fact, starting in the year 2000 will likely end up as the worst 30 year return in modern stock market history in the U.S.
The worst 30 year return over the past 100 years was 8% annually from the peak in September 1929.1 The dot-com peak is going to give that return a run for its money.
The S&P 500 would need annual returns of 12% per year from 2024-2029 to achieve an 8% return over 30 years. If annual returns were 10%, the 30 year annual return would be 7.6%. If they were 8%, you would get 7.2%.
Most of the time valuations don’t matter but sometimes they do.
The good news is most investors don’t put all of their money to work at the same time at the peak of a gigantic stock market bubble. People invest periodically out of their paychecks.
You make contributions on a weekly, monthly, quarterly or annual basis. You rebalance. You make changes to your asset allocation. You sell some of your assets to spend that money.
But even if you were the world’s worst market timer, earning 7% per year over the course of two or three decades isn’t all that bad.
Over 20 years, a 7% annual return would give you a total return of almost 300%.
At 7% over 30 years, now you’re looking at a return of close to 700% in total.
While a 6.9% annual return from 2000-2023 seems paltry, that’s still a total return of 410% for the S&P 500 with dividends.2
I don’t know what returns will look like in the future. People have been predicting lower returns for some time now yet it hasn’t really happened yet. It will at some point. I just don’t know when or how long it will last.
Regardless of what the returns are from here, the long run is your friend in the stock market.
Anything can and will happen in the short run. The long run is where compounding happens.
Success in the stock market is reserved for patient people.
Further Reading:
Updating My Favorite Performance Chart For 2023
1It’s amazing the stock market was up 8% per year in that time frame considering the market crashed some 85% during the Great Depression.
2After the lost decade in the stock market from 2000-2009, there is no way anyone would have believed you coming into the 2010s that returns would be this high for the 21st century by this point.